
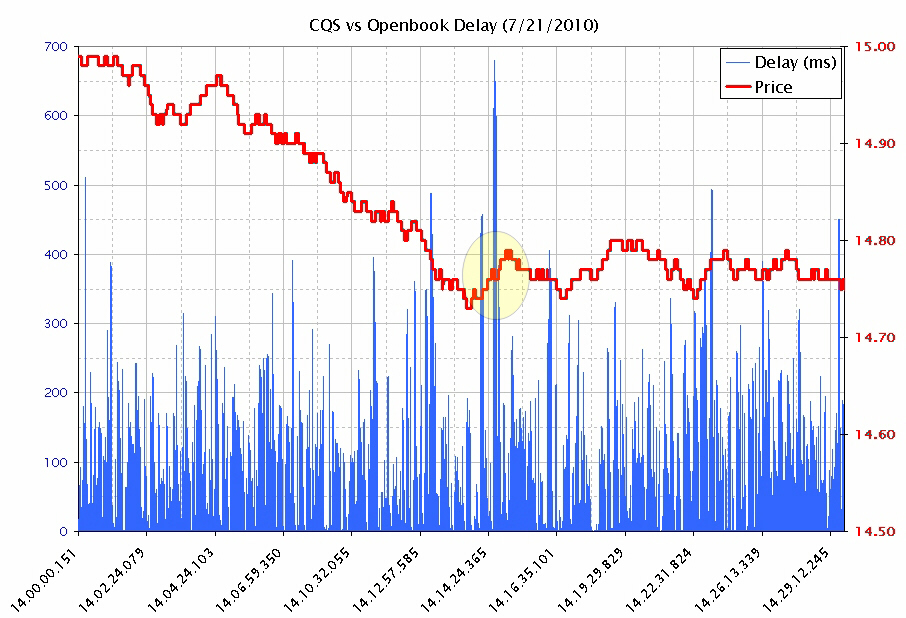
We wanted to see the extent of the delay between NYSE quotes from CQS and OpenBook on a more recent trading day. So we synchronized quotes from CQS and OpenBook for GE between 1pm and 4pm Eastern time and plotted 30 minutes worth of timestamp differences along with the quote price which are shown in Chart 1 below. We were surprised to see the frequency and magnitude of the delay. We thought high quote activity in a stock would cause a delay in that stock’s quote, but could not find any correlation between the quote activity in GE and the delay. Then we decided to focus on the one minute that had the highest delay, which is highlighted with a yellow circle in Chart 1. This one minute sample of the delay is plotted in Chart 2. |
Chart 1:
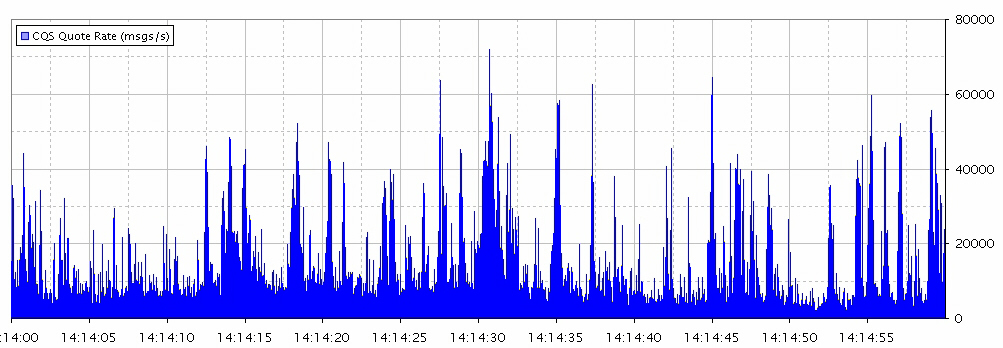
| Instead of looking at the quote rate for just GE, we decided to plot the quote rate for all stocks that NYSE sends to CQS. In other words, we plotted the sum total number of quotes where the listed exchange and reporting exchange are NYSE. This is plotted in Chart 3, which has the same time interval as Chart 2.
You can see that there is a very strong correlation between the quote rate in Chart 3, and the delay in Chart 2. Whenever the quote rate in Chart 3 exceeds 20,000/second, a corresponding delay is seen in Chart 2. The higher or longer the quote rate exceeds 20,000/second, the greater the delay. We then looked at all 3 hours and noticed the same relationship between total NYSE to CQS quote rate and a delay in GE. Then something very disturbing dawned on us. If the average or base quote rate is around 10,000/second, then it only takes an additional 10,000 quotes/second to reach the magic 20,000 quotes/seconds where a corresponding delay is seen in NYSE quote from CQS. This 10,000 quotes/second can be in any stock or combination of stocks that NYSE sends quotes to CQS for. The high occurrence of strange crop circles we have noted elsewhere, are suddenly beginning to make sense. |
Chart 2:
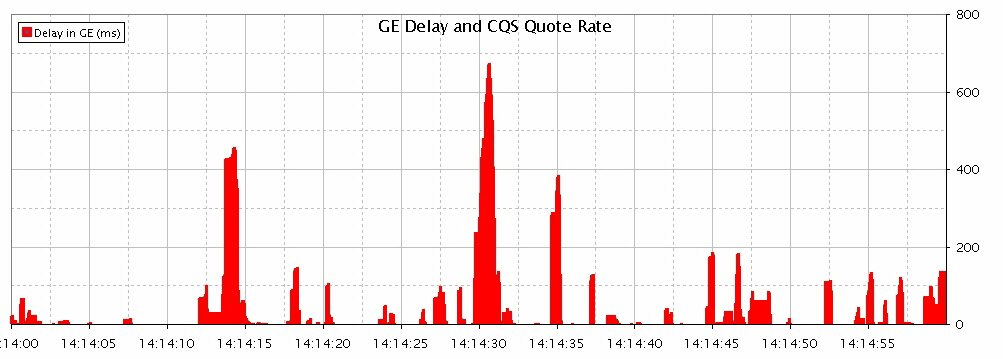
Chart 3: