
| May 6’th 2010 Flash Crash Analysis Continuing Developments Sell Algo Trades Publication Date: October 8, 2010 |
Update: April 11, 2012We received answers to the questions below: read the email exchange.Watch a video of the emini depth of book and an equity hot list as it looked during the flash crash. Update: April 10, 2012We recently reread the paper from Andrei Kirilenko and Albert (Pete) Kyle titled: The Flash Crash: The Impact of High Frequency Trading on an Electronic Market. As you may know, Kirilenko was a primary author of SEC final report on the flash crash, and often the same language appears in both papers. Based on interviews and our own independent matching of the 6,438 W&R executions to the 147,577 CME executions during that time, we know for certain that the algorithm used by W&R never took nor required liquidity. It always posted sell orders above the market and waited for a buyer; it never crossed the bid/ask spread. That means that none of the 6,438 trades were executed by hitting a bid. Therefore, the following statements from page 36 of Kirilenko’s paper cast serious doubt on the credibility of their analysis: (Similar language can be found in the SEC final report starting at the bottom of page 14.)
It is widely believed that the “sell program” refers to the algo selling the W&R contracts. However, based on the statements above, this cannot be true. The sell program must be referring to a different algo, or Kirilenko’s analysis is fundamentally flawed, because the paper incorrectly identifies trades that hit the bid as executions by the W&R algo. Another clue from page 31 of the same paper lightly hints at the possibility of a different algo (or just adds to their confusion):
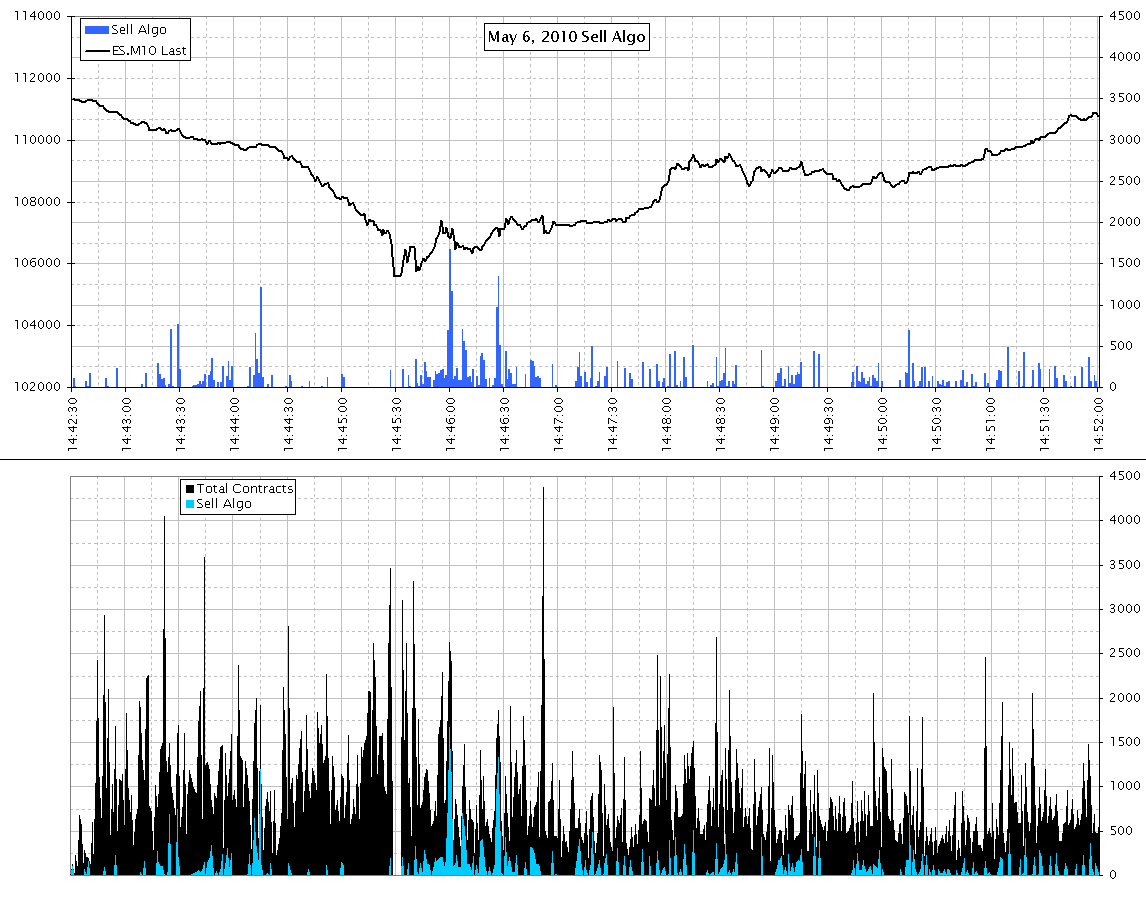
We know that the W&R algo sold 34,942 contracts during this period, which leaves more than 45,000 contracts unattributed. Could these 45,000 contracts that competed with HFTs for liquidity be from a different sell program? Probably not, because both papers indicate the sell program sold a total of 75,000 contracts, the exact number sold by W&R. Original TextClick for New Charts We have obtained the Waddell & Reed (W&R) May 6, 2010 trade executions from the executing broker in the June 2010 eMini futures contract. There were 6,438 trades totalling 75,000 contracts. We matched them by time, price and size to the 147,577 trades (844,513 contracts) in the CME time and sales data between 14:32 and 14:52 (they matched exactly). One-second resolution charts of the W&R trades along with other eMini trades are shown below in various time frames. The SEC report identified a Sell Algorithm selling 75,000 contracts as the cause of the flash crash. If the “Sell Algorithm” in the SEC report refers to the Waddell & Reed trades, then there is a problem. A big one. Looking at the trades in context with the other trades during that time, they do not appear to be significant. The W&R trades also do not occur near the ignition point (14:42:44.075) we identified earlier. Furthermore, the W&R trades are practically absent during the torrential sell-off that began at 14:44:20. The bulk of the W&R trades occurred after the market bottomed and was rocketing higher — a point in time that the SEC report tells us the market was out of liquidity. Finally, the data makes it clear that the algorithm does take price into consideration; you can see it stops selling if the price moves down over a short period of time. Something is very wrong here. |
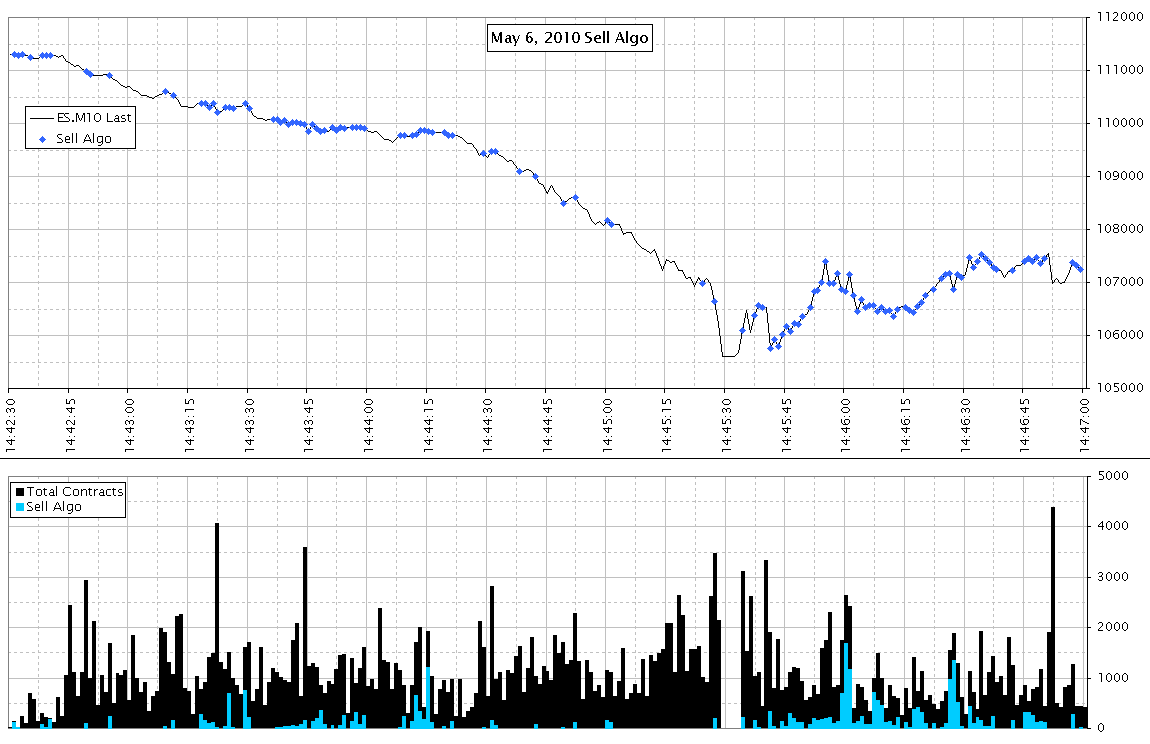
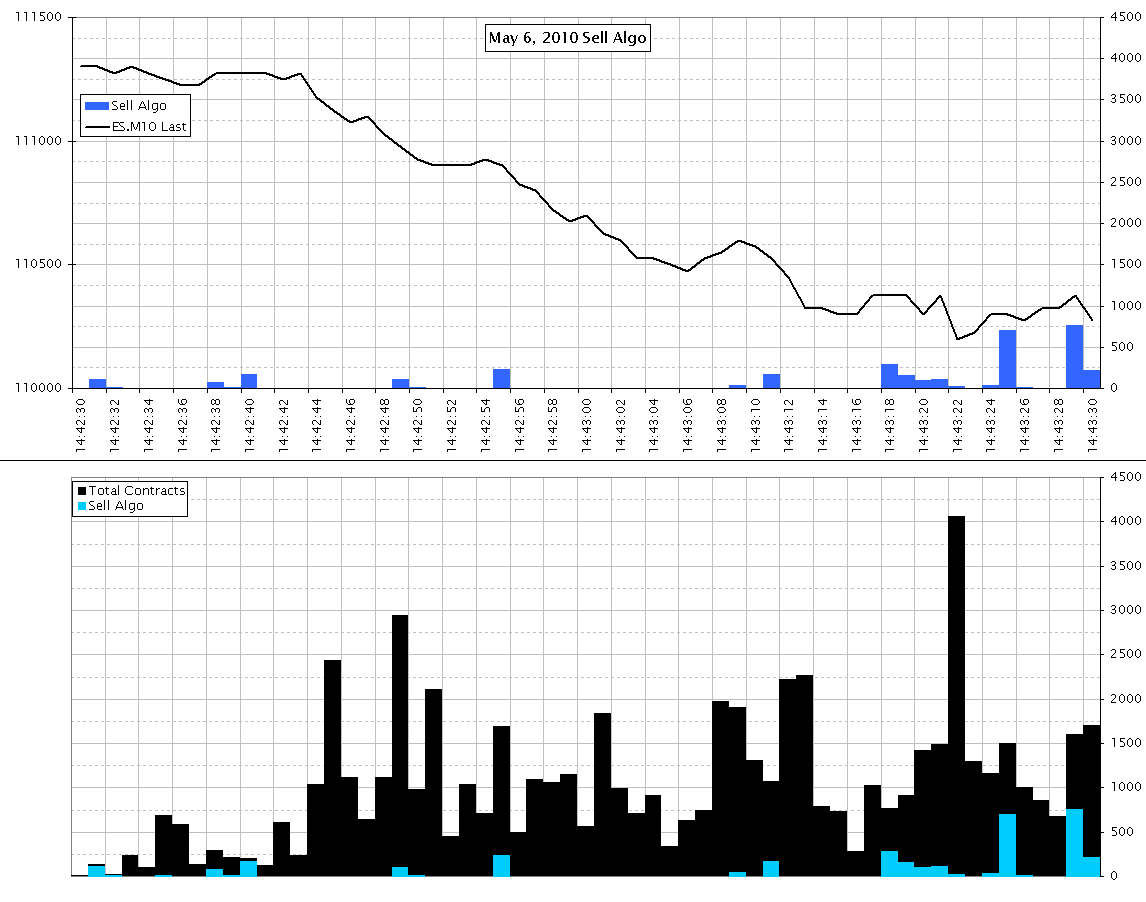
| 250 millisecond interval chart showing eMini depth and cumulative W&R contracts sold. Note how the selling rate increases when the market moves higher. This is because the W&R algo used mostly passive sell orders — when a buyer aggressively hits the offer price.
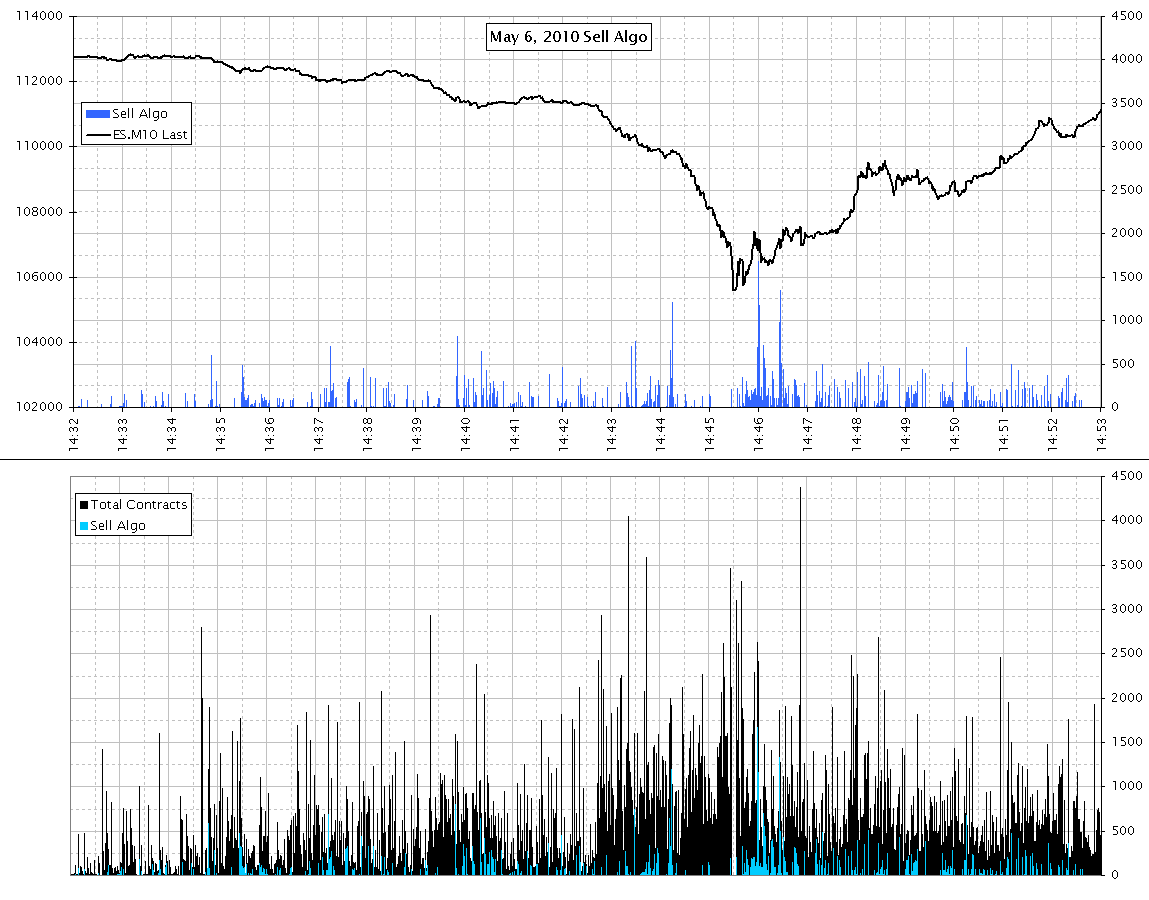
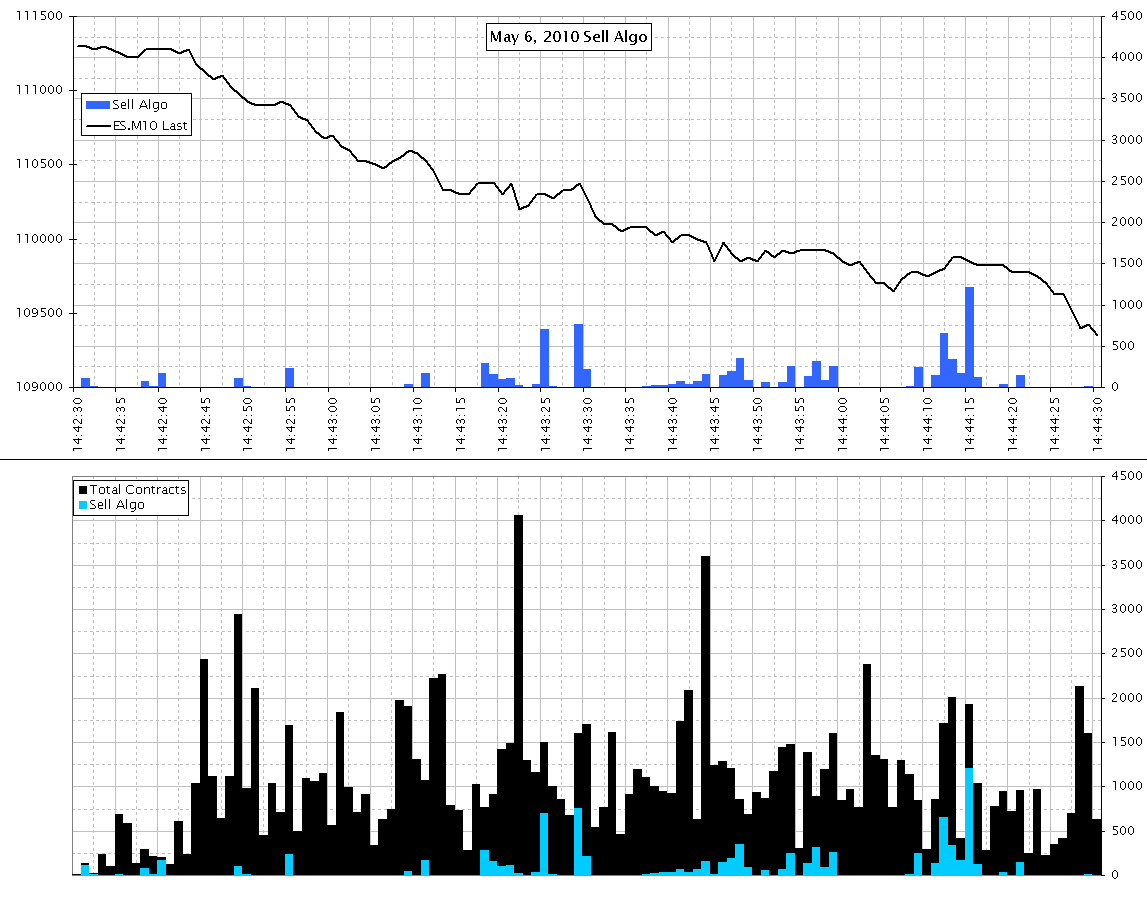
1 second interval chart showing eMini depth and cumulative W&R contracts sold.
|