
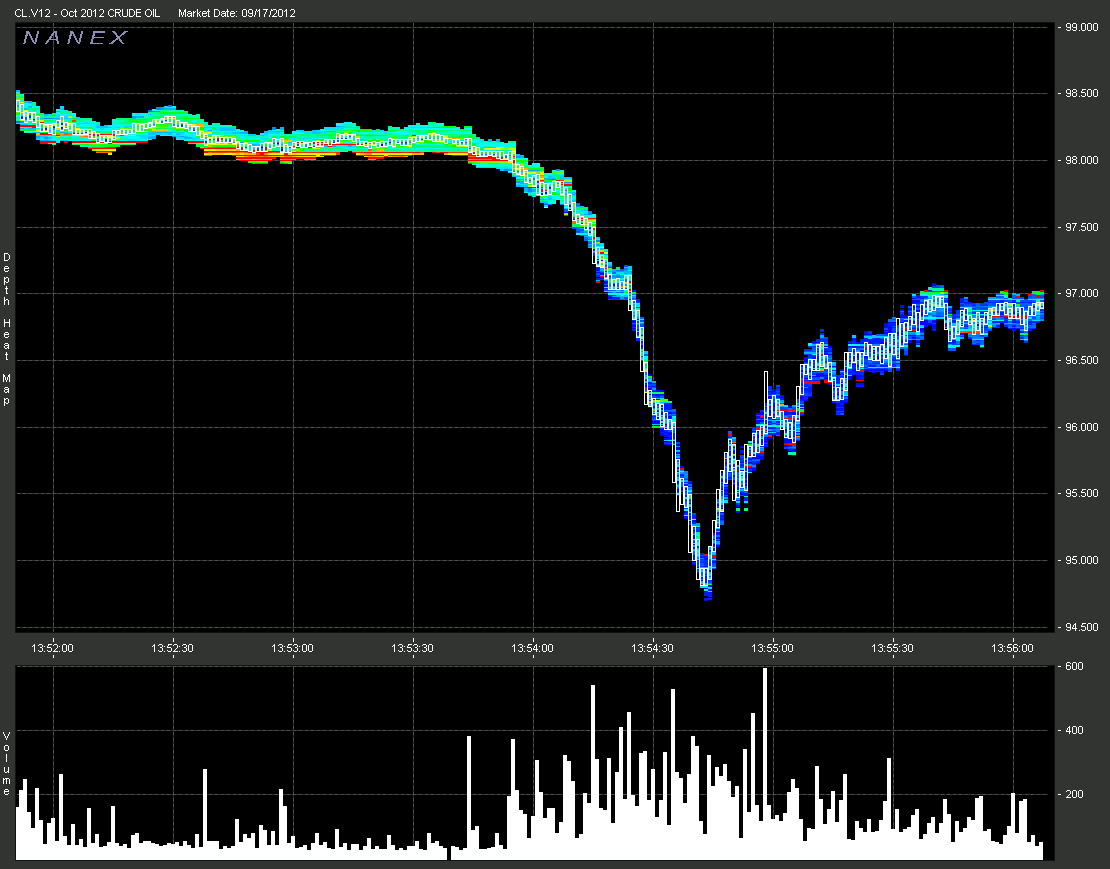
Nanex ~ 17-Sep-2012 ~ Crude Oil DropsOn September 17, 2012, starting at around 13:54, Crude Oil Futures dropped about 4% in about 1 minute. |
1. The following stack of images shows 25 millisecond crude oil depth of book charts. Click Next to step through 1 second at a time.
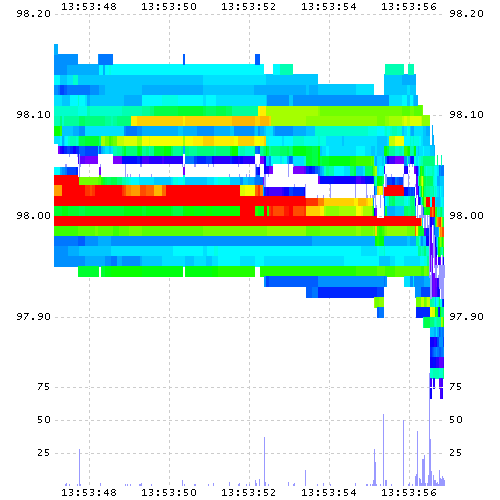
2. October 2012 Crude Oil Futures Depth of Book
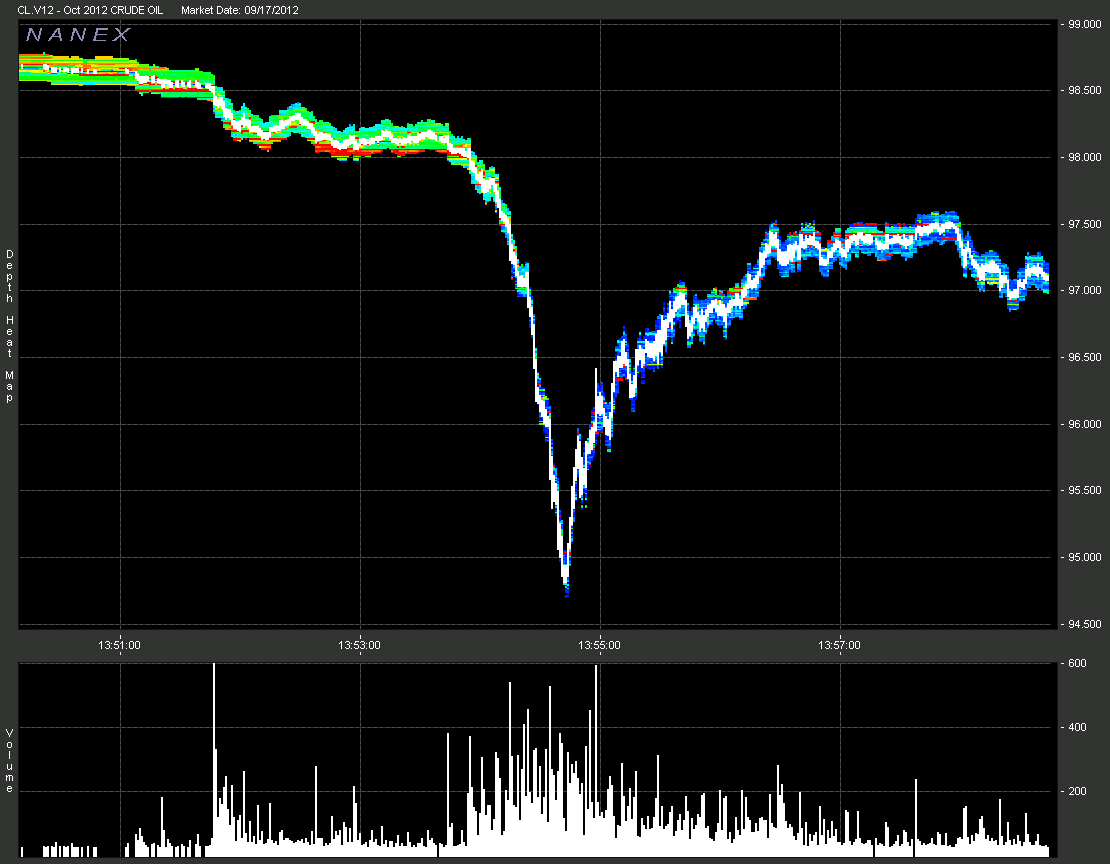
3. October 2012 Crude Oil Futures Depth of Book. Zoom of above.
About 1 minute from start of drop to bottom.
4. October 2012 Crude Oil Futures Depth of Book – showing depth levels. Zoom of beginning of move.
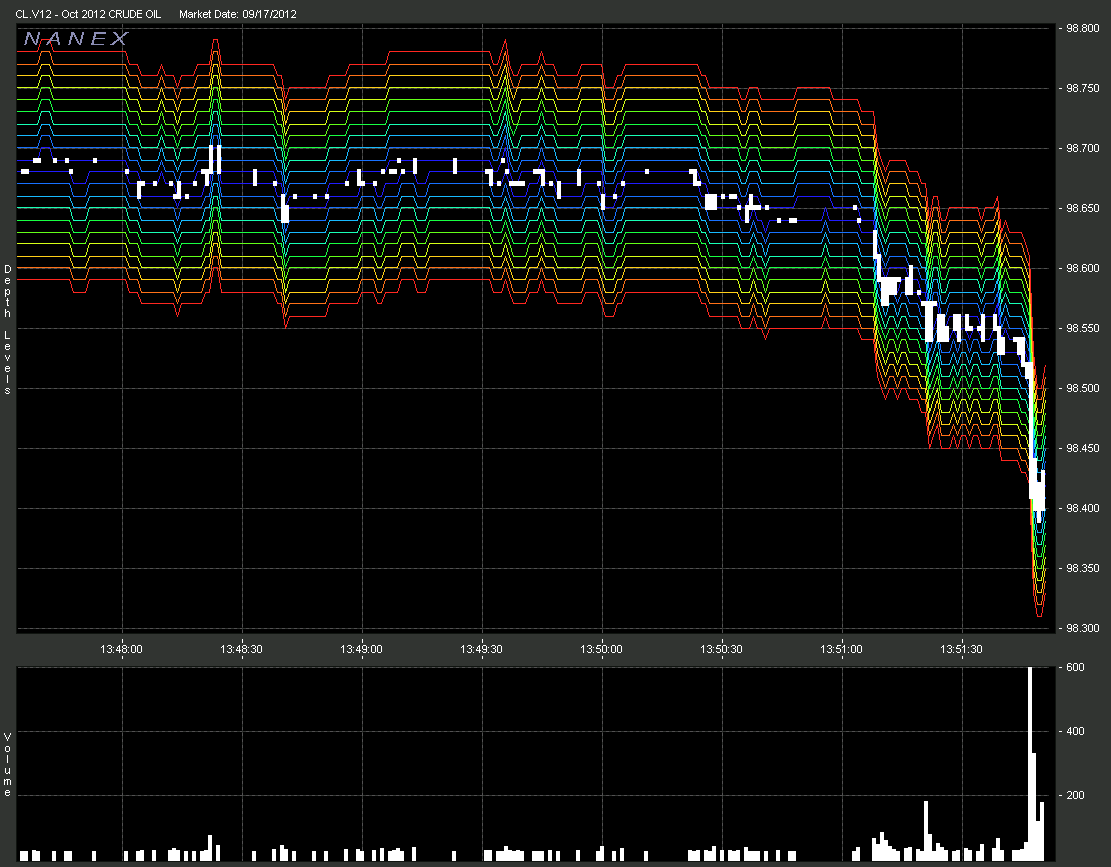
5. October 2012 Crude Oil Futures Depth of Book – showing depth levels. Scrolled ahead of Chart 3, just before next wave down.
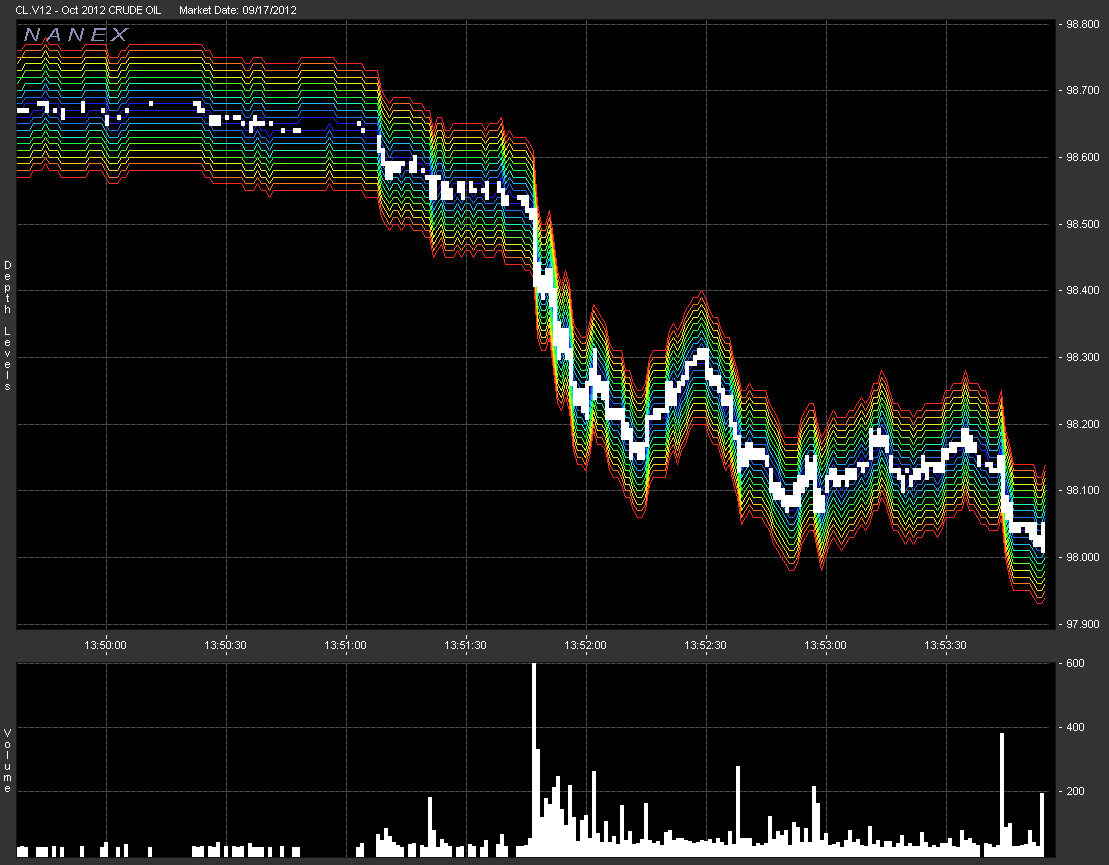
6. The following stack of 12 images (switch between them with prev/next buttons) are all 10 millisecond interval charts synchronized in time at the start of the move in crude oil.
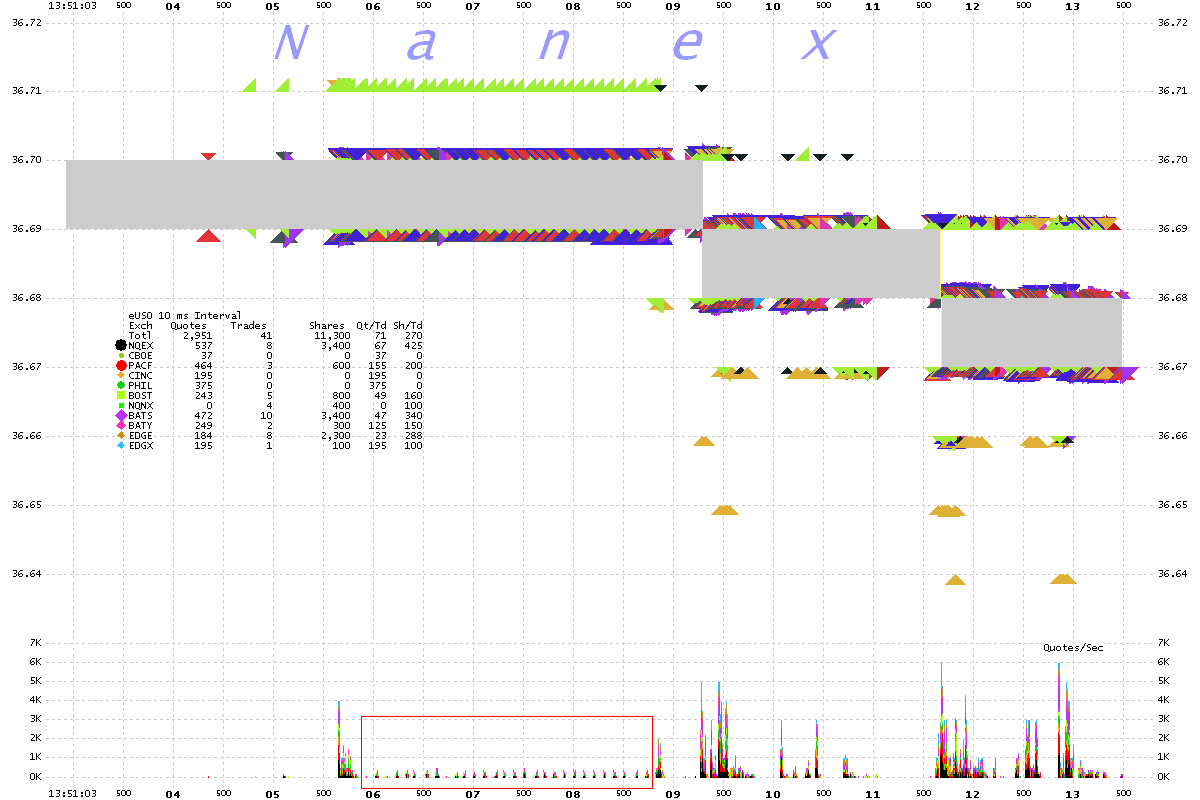
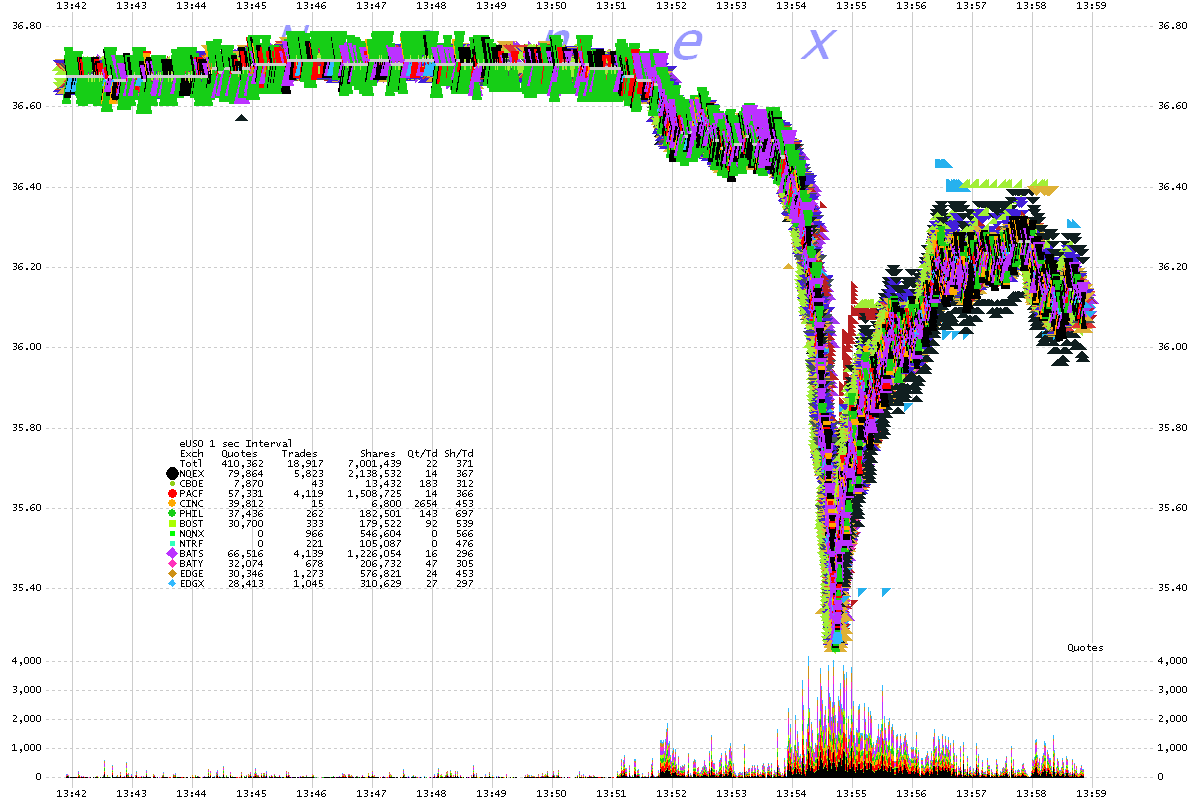
7. USO 1 second interval chart showing trades color coded by exchange
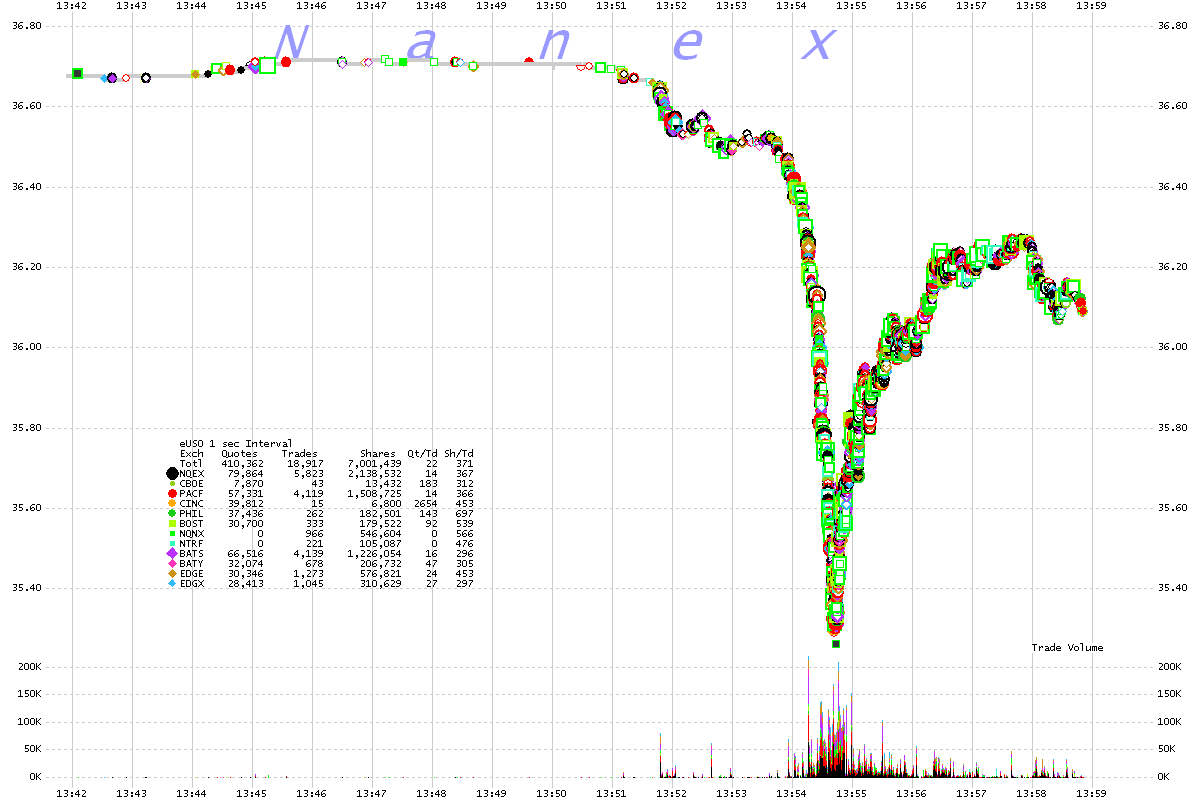
8. USO 1 second interval chart showing bids and offers color coded by exchange
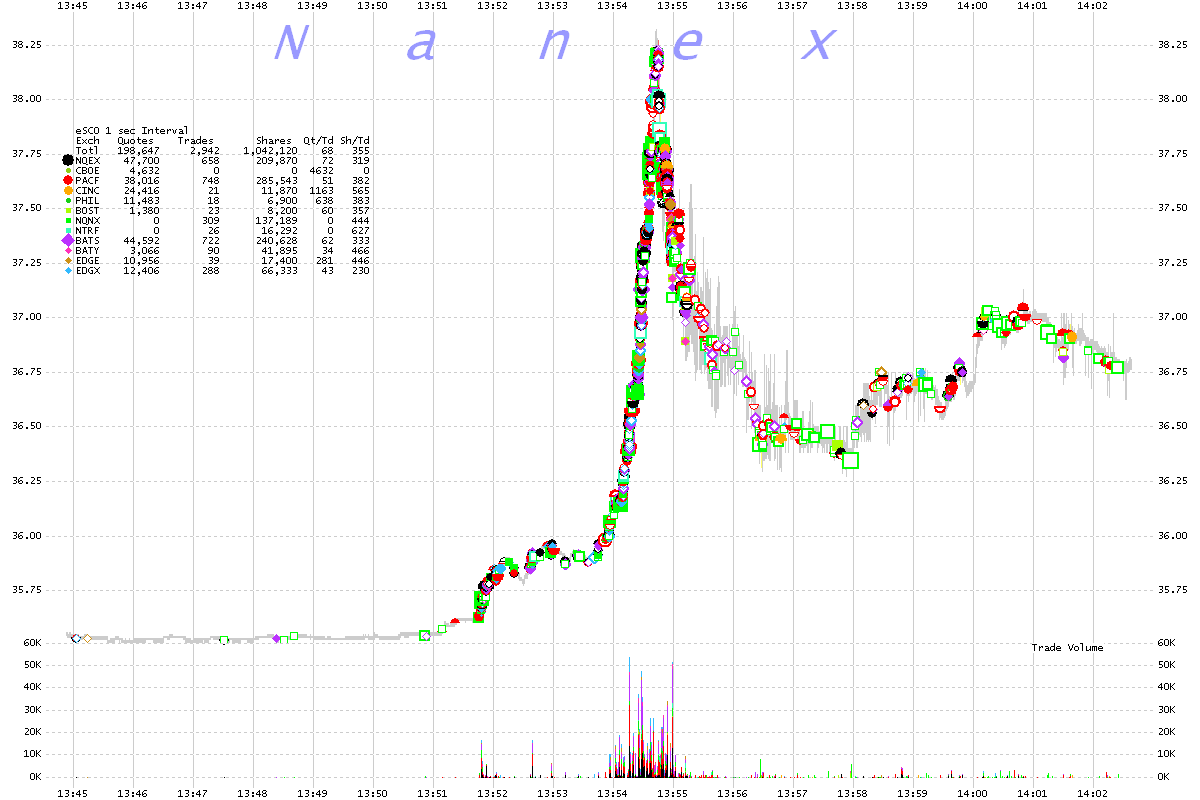
9. SCO 1 second interval chart showing trades color coded by exchange
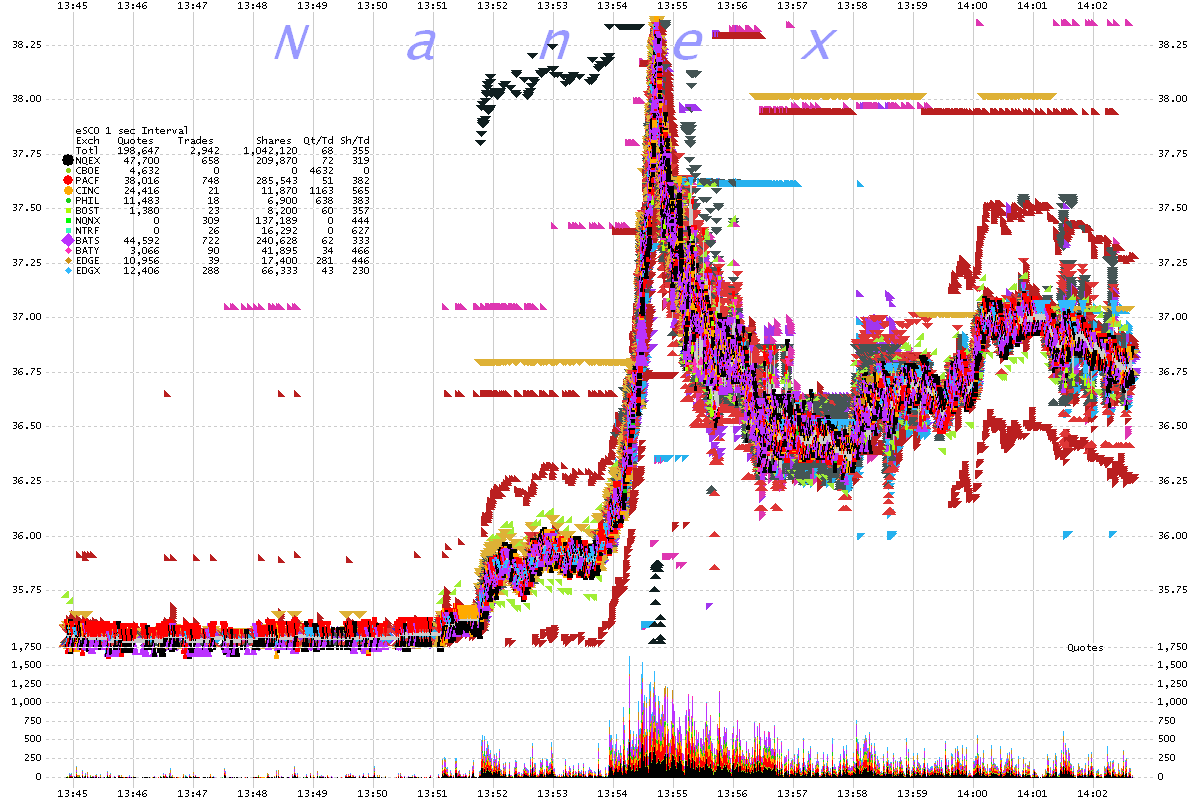
10. SCO 1 second interval chart showing bids and offers color coded by exchange
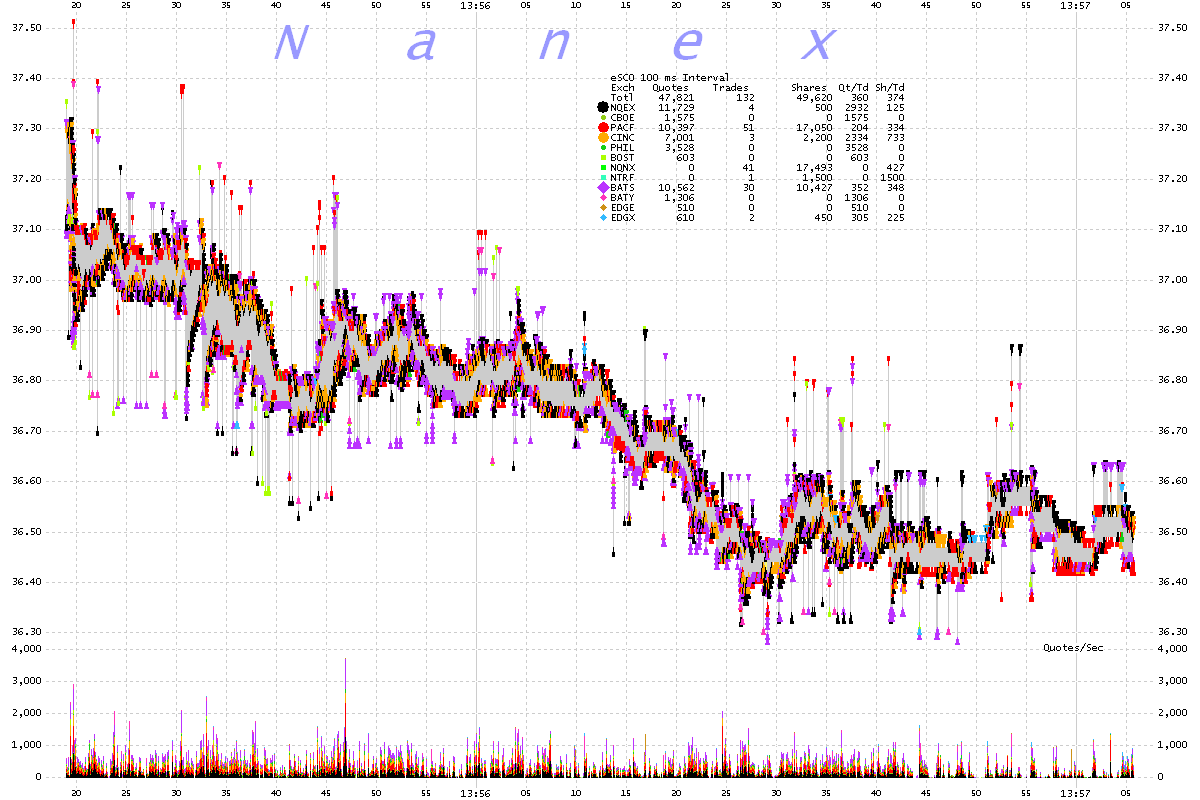
Cool mess of quotes. Not sure of the economic significance.
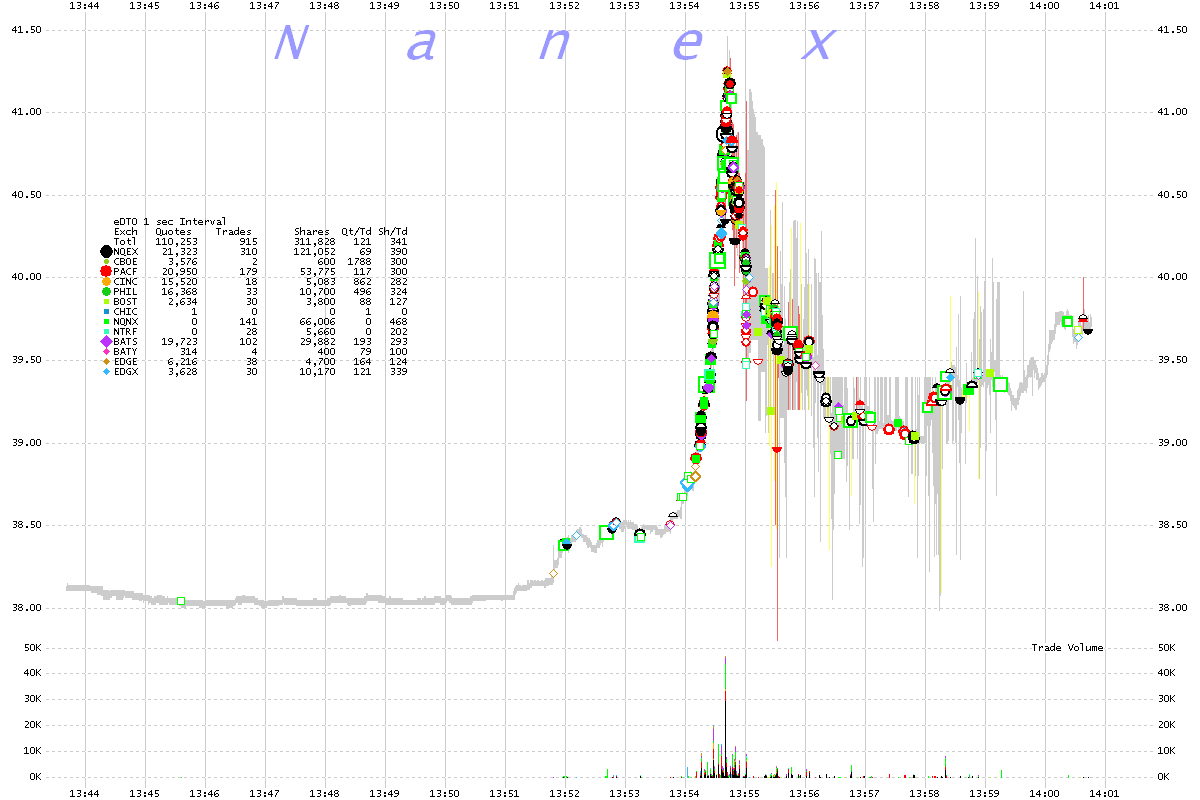
11. DTO 1 second interval chart showing trades color coded by exchange
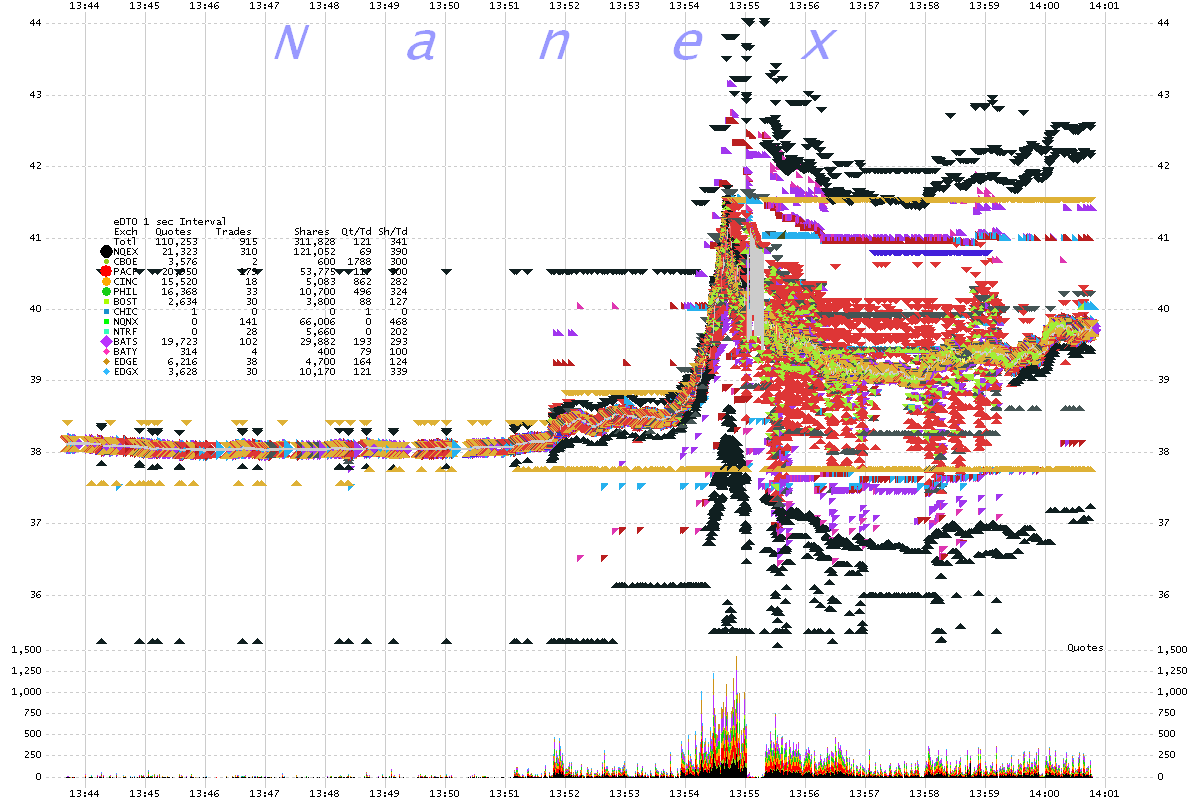
12. DTO 1 second interval chart showing bids and offers color coded by exchange
What is the point of all those quotes? Also, note the 20 second gap aroung 13:55.
13. SCO 100 millisecond interval chart showing best bids and best offers color coded by exchange
Crazy bid/ask spread flutter.