
Nanex ~ 16-Aug-2012 ~ Where is the Sub-penny Competition?
Well this is unexpected. Chart 1 below shows total volume for stock trades by fraction of a penny. The top pink/red line represents total share volume for prices 1/100th of a cent from nearest whole cent. The cyan/blue line below that is the total share volume for prices 2/100th through 9/100ths of a cent from the nearest whole cent. If there were healthy competition, the cyan/blue line should be above the pink/red. And we should see a better distribution of trades at 2/100 through 9/100.
More on sub-penny pricing.
Chart 1. Daily total share volume of US Stock trades with execution prices requiring 4 decimals of precision. The line labelled 1 is a plot of the volume of trades priced 1/100 away from nearest whole cent (x.xx01 and x.xx99)
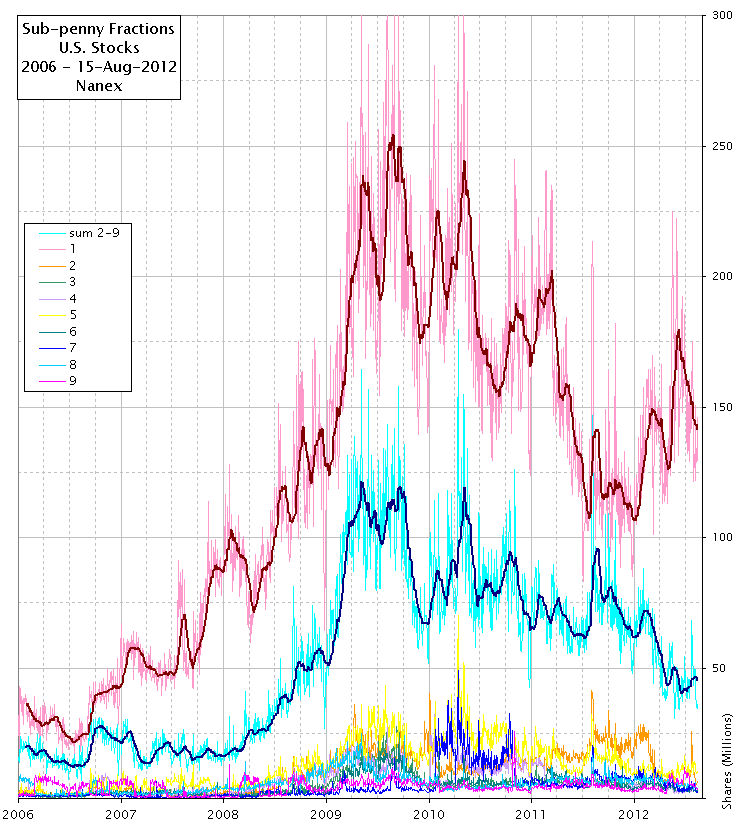
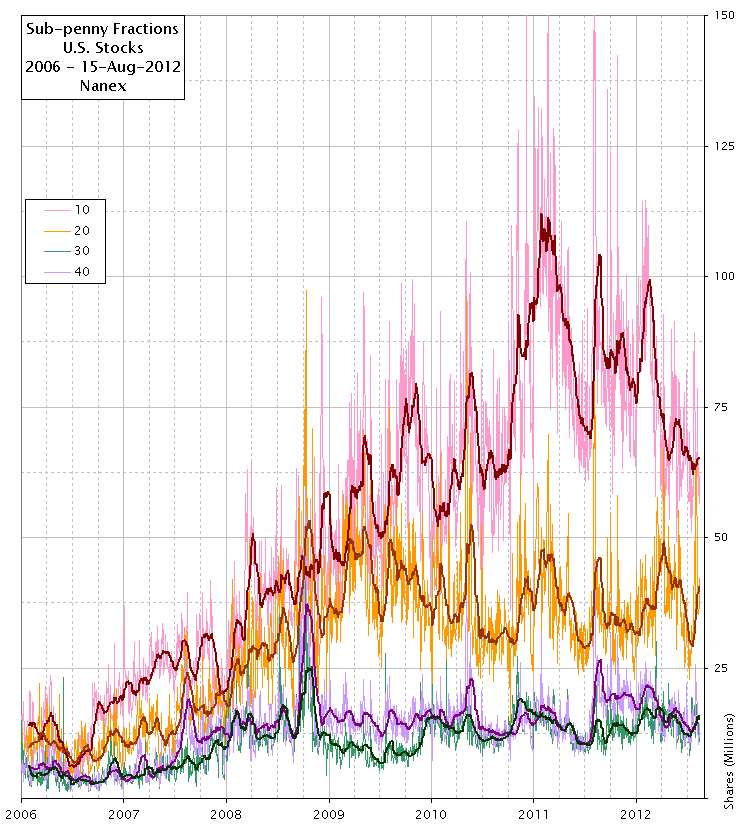
Chart 2. Daily total share volume of US Stock trades for trades prices at fractions 10/100, 20/100, 30/100 and 40/100 of a cent from the nearest whole cents. NYSE’s new Retail Liquidity Price Improvement program only allows sub-penny prices at 1/10th of a cent (10/100) from nearest whole cent.