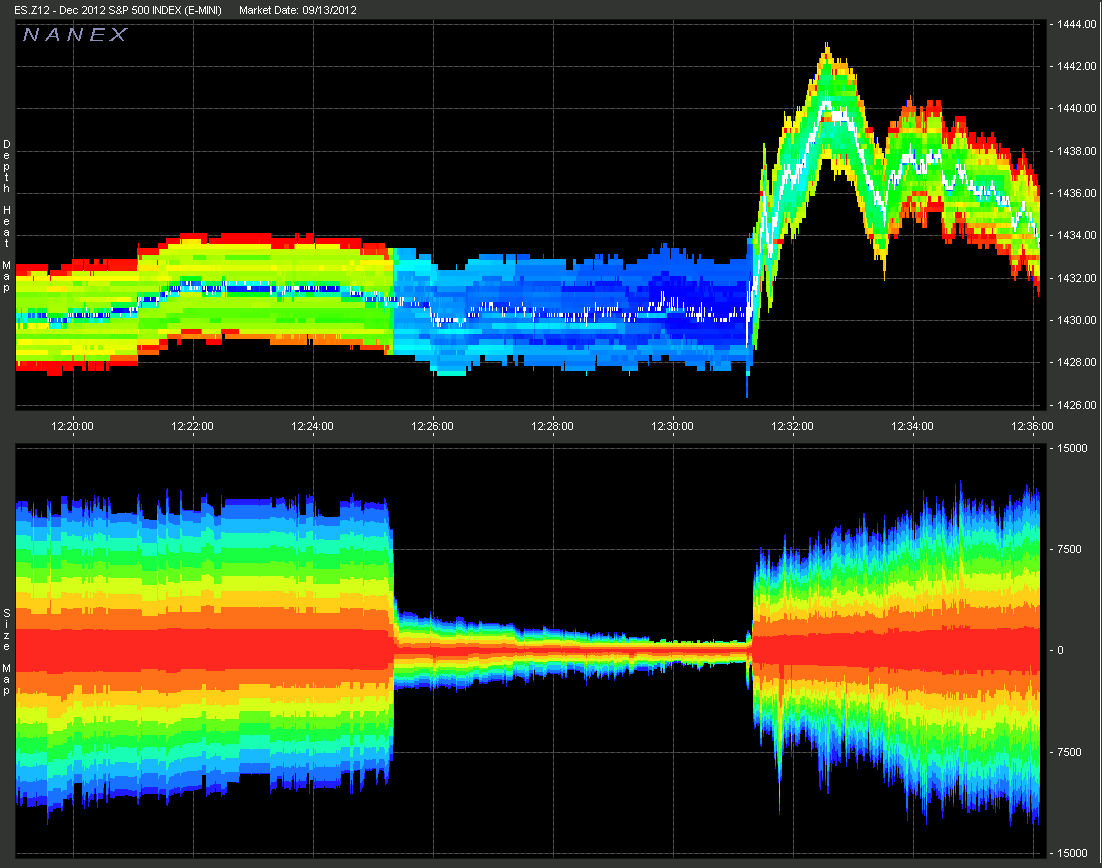

Nanex ~ 14-Sep-2012 ~ Disturbing LiquidityOn September 13, 2012, at 12:25:27, the December 2012 eMini contract experienced an evaporation of liquidity at such an alarming rate that it produced one of the most disturbing charts on market stability we have ever seen. Basically, about 80% of the orders resting in the book vanished in a second. To be sure, liquidity before major news events always dries up beginning 1 to 2 minutes before the scheduled time, but always, at, a, gradual, rate. This event tells us that either one firm controls 80% of this contract, or that algorithms have become dangerously susceptible to herd behavior and can be triggered to stampede in a heartbeat. See also: charts of SPY during this event. |
| The depth of book charts below use rainbow (ROYGBI) colors to indicate the relative size at each depth level. Red indicates a lot of size, blue indicates size approaching 0. Trade prices are shown in the top panel as white squares or rectangles. |