
Direct answer
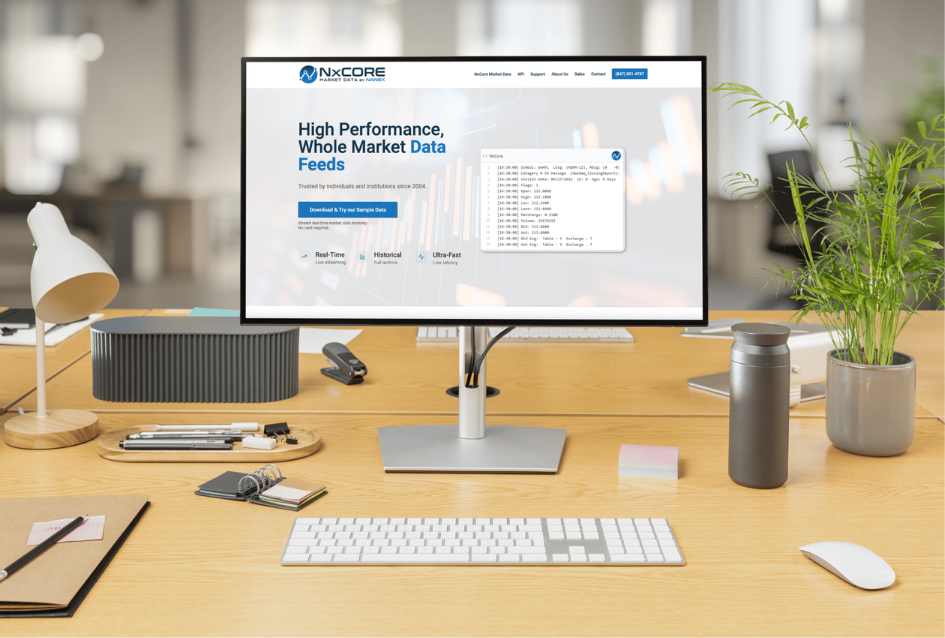
A professional market data feed is a production-grade stream that delivers tick-level trades and quotes with high-resolution timestamps, high throughput, and a stable normalization layer so research and execution use consistent data. NxCore delivers normalized, high-throughput market data over raw feed connections such as UDP/TCP, designed for infrastructure teams that need production-grade ingestion rather than dashboard-style API access.
Why this matters
Feed choice affects execution quality, backtest fidelity, and operational cost. Latency and tick fidelity directly impact realized slippage and backtest validity. Normalization and historical depth determine how easily research moves to production.
For quantitative teams, the gap between backtest and live performance often traces directly to feed quality differences.
How to evaluate feeds: Quick checklist
| Evaluation Area | What to Look For |
| Latency profile | Performance under normal AND stress conditions |
| Tick completeness | No sampling; high-resolution timestamps |
| Normalization | Consistent schema across exchanges and asset classes |
| Historical depth | Long archives designed for completeness and replay |
| Operational evidence | Sample data, validation artifacts available on request |
Comparison: Feed Types for Professional Trading
| Criterion | Normalized Multi-Asset Feed (NxCore) | Direct Exchange Feeds | Consolidated SIP |
| Latency | Low; designed for sub-ms environments | Lowest per venue | Higher due to consolidation |
| Coverage | Broad U.S. market coverage across equities and related instruments | Per exchange (requires multiple feeds) | NBBO and top-of-book only |
| Integration | Single normalized feed format | Multiple protocols, per-venue normalization | Simple but lacks depth |
| Cost model | Flat fee possible | Per-exchange fees + operational overhead | Lower subscription fees |
Real‑world example
A quant desk consolidated quoting and risk checks onto a single normalized feed. They ran a 30-day pilot measuring message rates, slippage, and backtest alignment. The normalized feed reduced integration work significantly compared to their prior mixed-vendor setup and produced backtests that more closely matched paper trading results. (Note: example results are for illustration; actual outcomes depend on specific infrastructure and market conditions.)
Common mistakes
- Assuming display feeds (Level 1 only) are sufficient for execution systems
- Underestimating throughput and storage requirements for tick data
- Using different vendors for backtest and live data, creating a persistent backtest-to-live gap
- Not validating vendor behavior under market stress (e.g., volatility spikes)
- Overlooking entitlements and licensing constraints until late in integration
Frequently asked questions
Q: Do I need tick data for all strategies?
A: No. Tick data is essential for microstructure and execution modeling. Longer-horizon strategies can use aggregated bars. Match granularity to your strategy’s sensitivity.
Q: How should I budget total cost for a market data feed?
A: Include bandwidth, processing, storage, exchange entitlements, and vendor fees. Flat-fee models can simplify TCO for high-throughput users.
Q: How can I validate a vendor before committing?
A: Request sample data tapes, validation reports, provenance documentation, and run a 30-day pilot with your representative instruments.
Q: Is lower latency always better?
A: For execution systems, yes, but only if latency is consistent (low jitter). For research, historical depth and correctness often matter more than speed.
Who This Is For / Who This Is NOT For
For: Quant teams, trading infrastructure engineers, firms building execution systems.
NOT for: Retail traders, dashboard-only users, low-frequency strategies.
What to do next
Map each workflow to required latency, granularity, and coverage. Request sample data and a 30-day pilot that measures message rates, latency under load, and backtest-to-live alignment.