

Direct Answer
Historical market data is a record of past market activity – prices, trades, quotes, and order book changes – archived for analysis.
It can be stored at various granularities: tick-level data capturing every event, intraday bars aggregating activity, or daily OHLC summarizing each session.
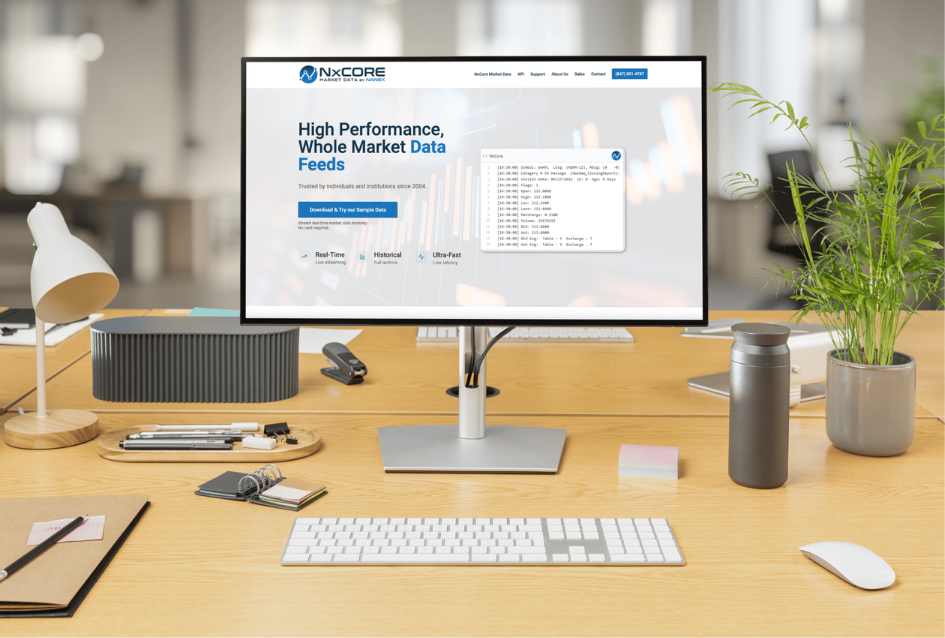
NxCore provides 20+ years of tick-level historical data for U.S. equities, options, and futures – in the same format as the live feed, with corporate actions applied and delisted securities included.
Why Historical Data Matters
Every trading model depends on historical data to validate signals and measure performance before risking capital.
A backtest is only as reliable as the data behind it. If that data has gaps, incorrect adjustments, or survivorship bias, your strategy’s apparent edge may be an artifact of bad inputs.
Historical data isn’t just “old prices.” It’s the foundation of quantitative research.
Historical Data Granularity
| Data Type | Granularity | Best Use Case | Storage |
| Tick data | Every event | HFT, execution modeling | Very large |
| 1-second bars | Per second | Fast intraday strategies | Large |
| 1-minute bars | Per minute | Intraday trading, charting | Moderate |
| Daily OHLC | End-of-day | Swing trading, fundamentals | Small |
The right granularity depends on strategy timeframe. NxCore provides tick-level data that you can aggregate as needed.
How NxCore Delivers Historical Data
NxCore’s historical archive includes:
- 20+ years of tick data – U.S. equities, options, futures
- Same format as live feed – no conversion between backtest and production
- Corporate actions applied – splits, dividends, symbol changes
- Survivorship-bias-free – includes delisted and acquired securities
- Gap-free – validated against exchange records
- Microsecond timestamps – proper event sequencing
Your backtest environment uses exactly the same data structure as your live system.
NxCore vs. Other Historical Data Sources
| Feature | NxCore | Bloomberg | Polygon | Free Sources |
| Historical depth | 20+ years tick | Varies by product | ~5 years | Limited |
| Format consistency | Same as live | Terminal format | API format | Inconsistent |
| Corporate actions | Applied | Applied | Applied | Often missing |
| Delisted securities | Included | Included | Limited | Excluded |
| Granularity | Tick-level | Varies | Tick available | Daily typical |
| Pricing | Flat fee | Expensive | Usage-based | Free/low cost |
NxCore offers the deepest tick-level archive with the simplest integration – same format for research and production.
Adjusted vs. Unadjusted Data
| Attribute | Adjusted Data | Unadjusted Data |
| Price continuity | Maintained across splits/dividends | Gaps at corporate action dates |
| Return calculations | Accurate | Incorrect without adjustment |
| Use case | Backtesting, strategy development | Execution analysis, compliance |
| NxCore approach | Adjusted by default | Unadjusted available if needed |
For backtesting, use adjusted data. NxCore applies corporate actions to maintain price continuity.
Real-World Example
A quantitative fund backtested a momentum strategy showing 25% annualized returns over 15 years.
Before deploying capital, they audited their data:
Problem 1: Unadjusted prices showed a 75% “crash” on a 4:1 split date. The strategy interpreted this as a momentum signal and shorted – a disastrous trade. After adjustments, returns dropped to 18%.
Problem 2: The dataset excluded companies that went bankrupt. The backtest could only hold “survivors.” Adding delisted securities dropped returns to 11%.
The original 25% was a data illusion. The real strategy was profitable but far less impressive.
NxCore’s approach: Corporate actions applied, delisted securities included, 20+ years of validated history. No phantom returns from data errors.
Common Mistakes
- Using unadjusted equity data – splits and dividends corrupt return calculations
- Ignoring survivorship bias – excluding delisted securities inflates returns
- Mixing data sources – different vendors use different adjustments and formats
- Using bar data for tick-sensitive strategies – minute bars hide execution dynamics
- Not validating timestamps – imprecise timestamps corrupt signal sequencing
- Assuming all historical data is complete – even reputable vendors have gaps
Frequently Asked Questions
What’s the difference between tick data and OHLC data?
Tick data captures every event with precise timestamps. OHLC aggregates activity into open, high, low, close over intervals. NxCore provides tick data; aggregate as needed.
Do I need adjusted data for equities?
For backtesting, yes. NxCore applies corporate actions – splits, dividends – to maintain price continuity.
Why does historical data differ between vendors?
Different sources, cleaning methodologies, corporate action handling, and timestamp precision. NxCore provides consistent methodology documented for users.
Is historical Level 2 data available?
Yes. NxCore provides historical order book data. It’s larger and more specialized than trade-and-quote data.
How far back does NxCore data go?
20+ years for U.S. equities. Coverage for options and futures varies by product.
What is survivorship bias?
When historical data excludes securities that were delisted or went bankrupt, inflating returns. NxCore includes the full historical universe.
What to Do Next
Choose historical data granularity matching your strategy’s sensitivity to timing and execution.
NxCore provides 20+ years of tick-level history – same format as live, corporate actions applied, survivorship-bias-free. Research and production use identical data.