

NBBO InstabilityRecent algo that starts at 9:45 coincides with NBBO Instability |
More Nanex Research 
|
| There is a new phenomenon that began on January 10, 2012 (first reported here). It started with about 80 stocks and has grown.
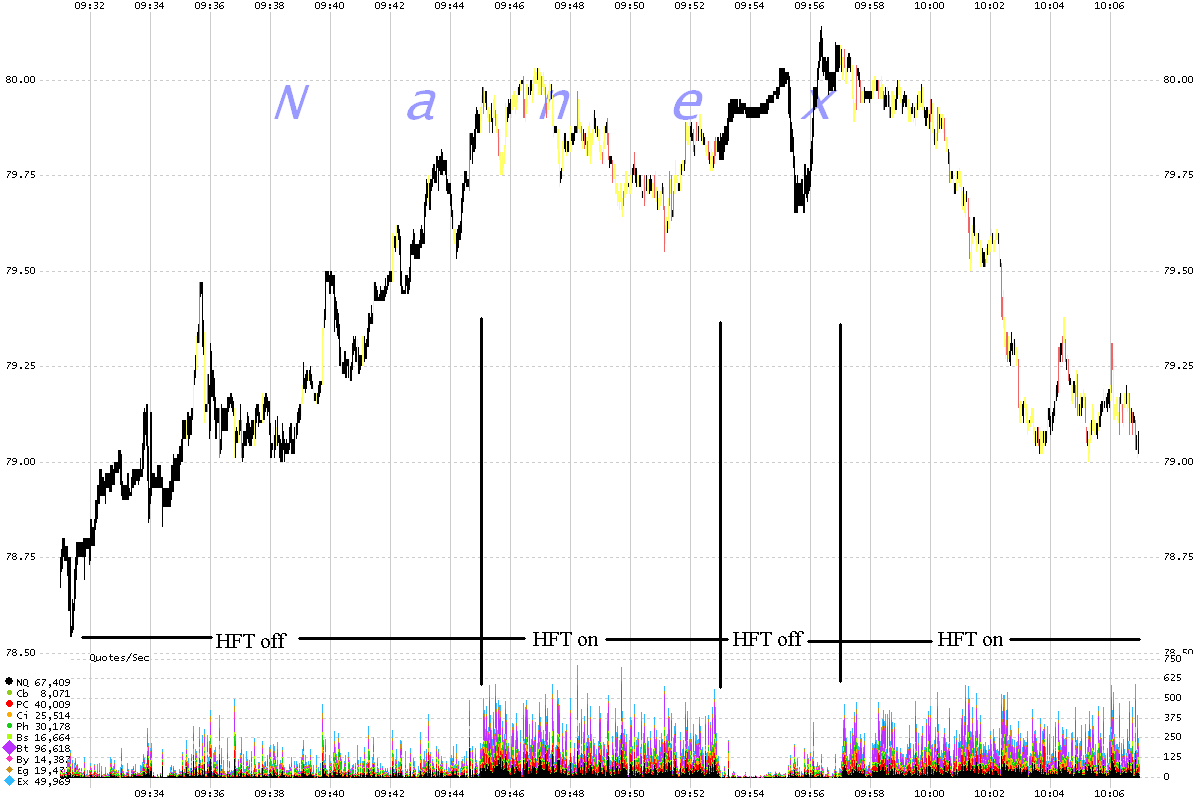
This algo turns on at 9:45, then off at 9:58, and back on again at 10:02. When this algo is running, the quote rate increases 10-fold and the occurrence of a locked or crossed NBBO (National Best Bid or Offer) increases significantly. The instability of the NBBO spread increases when the algo is running. In each of the charts, the occurrence of a locked or crossed market is much higher when the algorithm runs. On January 27th, coinciding with the release of the Michigan’s consumer sentiment index at 9:55, the algo turned off earlier at 9:53 and resumed at 9:57. This indicates the algo is news sensitive and withdraws. In other words, when the market needs market making HFTs the most, they have already withdrawn. |
| FAS on January 27, 2012 (2 second intervals). The NBBO is shaded black for a normal market, yellow for a locked market (bid equals ask) or red for a crossed market (bid > ask). On this day, the algo turns off at 9:53, turns partially back on at 9:55, and resumes in full at 9:57. See more examples on previous days. |
(click charts for higher resolution)
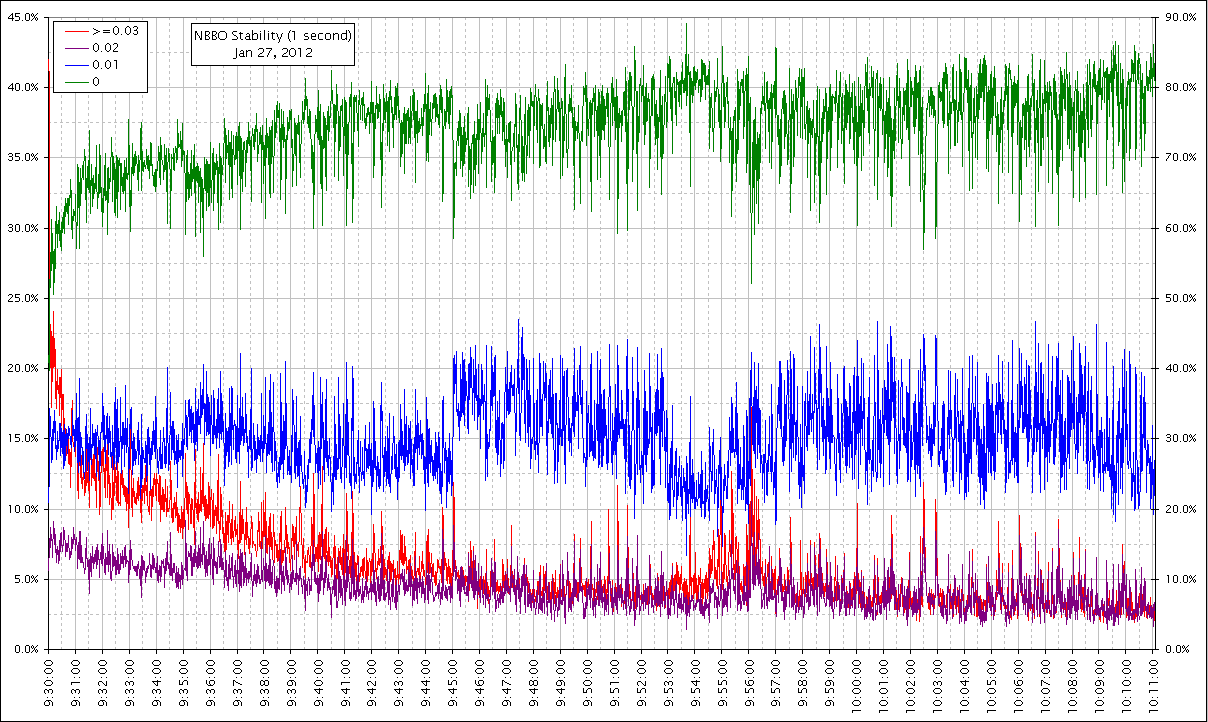
| 1-second NBBO Stability. The difference between the maximum and minimum of NBBO for every second is a good indication of the stability of the NBBO. Below is a chart showing the total counts for all equities (expressed as a percentage of the number of equities with quotes). Note how changes in the blue line matches the times when the algo is running. The blue line represents stocks with an NBBO that flutters $0.01 each second (from $0.01 to $0.02 or $0.05 to $0.06 for example). A stable NBBO will not flutter at all (green line). |
 (click charts for higher resolution)